diana lam
Predicting the Success of Lower Budget Movies - An Analysis of Revenues vs. Recognition
As I mentioned in last week’s post, I’ve been working for the past two weeks on a linear regression model to predict the success of lower budget movies. If you’re a follower of the movie industry, you probably already know that it isn’t as profitable as it used to be. Ticket sales per capita and gross revenues are down as more people turn to streaming services and television shows for their dose of cinematic drama.
This leads to the question–how can the movie industry continue to survive and profit? One easy solution would be to minimize spending and hopefully maximize profits. This article in last week’s New Yorker has a great discussion of the rise of the mid-range movie studio and how there’s far more profitability to be had in this range than in the high budget movie range.
The goal
So if you’re a lower budget movie maker, what type of movie should you make to maximize your chances at success? Are these features different if you’re looking to maximize revenues vs. recognition through Oscar nominations?
A cursory look at top movies in each success category indicates that there may be a well-defined answer to the latter question. Take Teenage Mutant Ninja Turtles (the original, a serious childhood throwback) and Birdman, last year’s Oscar winner for best picture. TMNT was one of the top grossing movies of all time with a budget of under $30 million. It made around $270 million in revenues (adjusted to 2015 dollars), compared to Birdman, which only made $43 million. However, Birdman was nominated for nine Oscars, whereas I don’t think anyone would put TMNT up for an Oscar nomination.
The approach and data
As I discussed in my previous post, all of my movie data came from Box Office Mojo. I used Beautiful Soup 4 to scrape data for all 16,100+ movies on the website. This data was supplemented with Oscars information from Newsday, a Long Island based newspaper that had a surprisingly detailed history of Oscar nominations since 1928.
Of the 16,100+ movies, only about 2,900, or 18 percent, had production budget data. I chose a budget threshold to define “lower budget” – I initially wanted to go with movies under $10 million, but that seemed to limit my data a bit too much, so I went with $30 million, which seemed to capture a good number of “successful” movies with a relatively low budget.
The analysis
The nitty gritty: Since I was trying to predict gross revenues and Oscar nominations, both continuous variables (or so I thought! more about that later), I used a linear regression model. The process was very iterative, beginning with a high-level exploration of relationships between features and my success variables to check for the normality of distributions. Using statsmodels and sci-kit learn, I looped through various combinations and transformations of my features until I identified and refined the features with statistically significant predictive power. During this process, I used k-fold cross-validation to evaluate average mean squared error and r-squared for my models, choosing the ones with the lowest MSE and highest r-squared.
I tested a wide range of features; below are the ones that were included in my final models. A (+) next to the feature indicates a positive impact on movie success, whereas a (-) indicates a negative impact. Since the gross revenues and Oscar nominations data were both skewed, I wound up normalizing these variables both models by taking the natural logarithm of each; this means that each unit increase in my features resulted in a percentage increase/decrease in revenues/nominations as determined by the feature’s coefficient.
| Feature Type | Revenues Model | Oscars Model |
|---|---|---|
| Release season | holiday release (+) | holiday release (+) |
| MPAA rating | rated G, PG, PG-13, R (+) | rated R (+) |
| Budget | (+) | no impact |
| Theaters | (+) | theaters^3 (-) |
| Runtime | (+) | (-) |
| ROI (log-transformed) | N/A | (+) |
| Genre | horror (-) | foreign, war, drama, history (+) |
| Actor/director previous oscar nominations | actor + director (+) | actor (log-transformed) (+) |
A few notes/interesting tidbits that stood out to me:
-
Holiday release was significantly correlated with success in both models, but release season is not really a defining feature of a movie. As we all know, the good movies are released during Oscar season (November - December) and bad movies are “dumped” in the January - February months. Just releasing a movie during the season that other good movies are released doesn’t make your movie good, so this correlation should be taken with a grain of salt.
-
Revenues tended to increase as movies became more “adult” – PG movies made more than G, PG-13 more than PG, and R more than PG-13. NC-17 movies did the worst out of all the ratings.
-
My hunch that budget had little impact on Oscar nominations was proved to be true. When you think of the big action movies that cost $200 - $300 million to make but are all for show, this makes sense.
-
Interestingly enough, releasing a movie in more theaters led to a decline in Oscar nominations. I’m still pondering over this one, but my hunch is that it has something to do with the point above–the really big blockbusters are usually more for audience entertainment and less for the art of movie making.
While all of the above features had significant p values, some features were definitely more predictive than others. The two charts below show how much weight each feature pulled in determining the predictive power of each model.
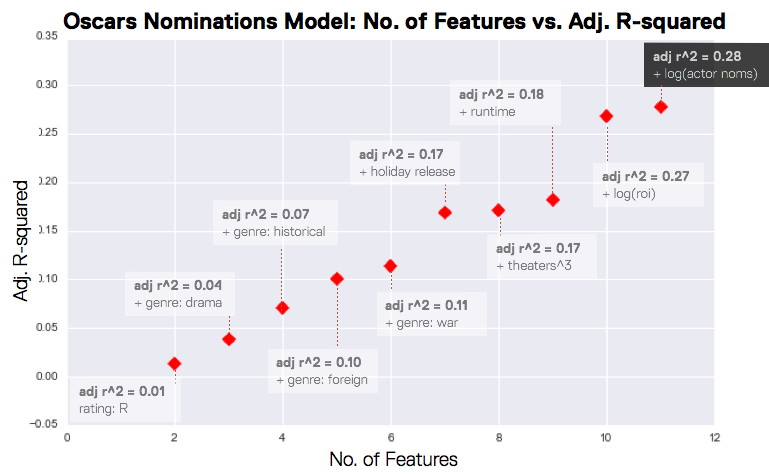
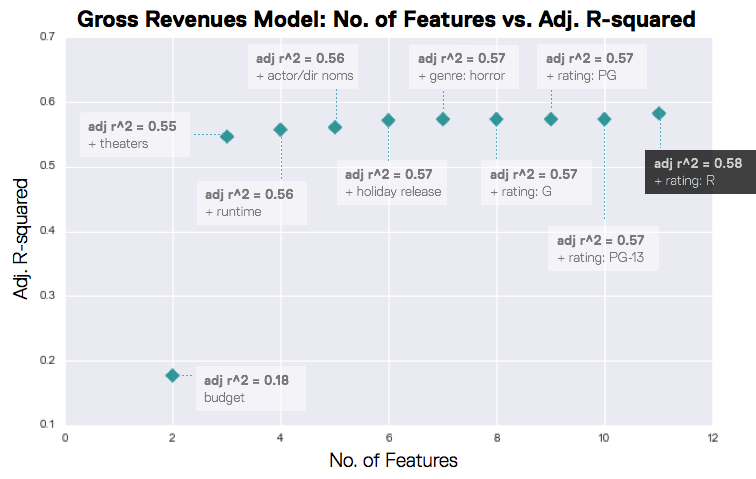
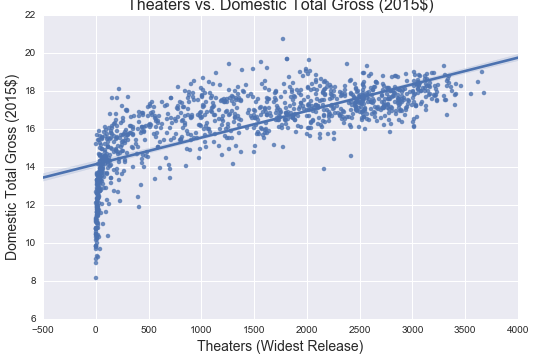
In the Oscars model, predictive power was evenly distributed among all features, where as in the revenues model, theaters accounted for the majority of the predictive power. We can see how highly correlated theaters are with gross revenues in the plot below.
Findings
So how did my models fare? At the end of the week, my gross revenues model had an r-squared of almost 0.6, whereas my Oscars nominations model had an r-squared of almost 0.3. The predictive power of both could be improved with more time and features, but the models definitely revealed a few different features to consider if you’re making a lower budget movie and want to…
Maximize revenues
- Don’t make an NC-17 movie, since they make the least out of all the other rated movies. Make an R-rated movie for the greatest revenues, since revenues tend to go up when you move up the G > PG > PG-13 > R scale.
- Spend more money.
- Make anything except a horror movie.
- Most importantly, release your movie in as many theaters as possible.
Maximize Oscar nominations
- Make an R-rated movie. They make more than any other genre.
- Make a drama, foreign, historical, or war movie.
- Get actors with a lot of past Oscar nominations. Oscar-nominated directors don’t matter as much.
- Don’t worry about spending more money. It doesn’t really have an impact on how good or movie is (at least to the Academy).
Next steps
I’d love to continue to iterate on these models and explore more features to improve predictive power. Specifically:
-
Interaction features would be interesting to explore here, particularly between genre and rating.
-
The budget information I obtained was limited to production budgets. In reality, movies spend millions more dollars on marketing, especially if there isn’t a built in audience from a prequel or book. It would be fascinating to find the true budget of these films and do a study on the impacts of production vs. marketing budgets.
-
Finding a way to describe the actual type of movie via content and plot would also be interesting, especially in the Oscars model. I could see a great study coming out of this with natural language processing through movie scripts.
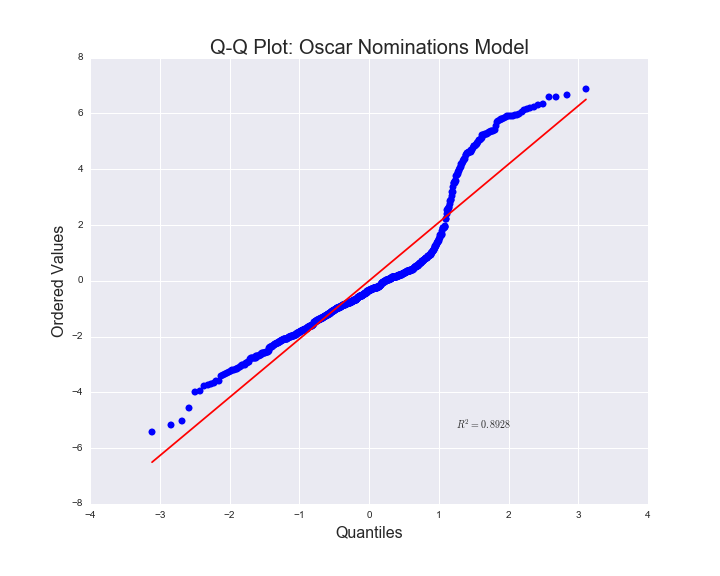
As I hinted at above, a linear regression model probably wasn’t the best to predict Oscar nominations, since nominations aren’t quite a continuous variable. The Q-Q plot below, which is essentially an indicator of how normally distributed my residuals are, and therefore if the data is a good fit for a linear regression model, indicates that a linear regression model probably isn’t the best (the distribution should be a straight line).
A classification model would probably work better here since the salient point with Oscars is more about whether or not a movie was nominated or won, not the number of nominations. A clustering analysis would also be interesting to try and determine common features between movies that transcend the common labels of rating and genre.
Finally–I found the comparative nature of the study to be quite revealing. I’d love to extend this to movies of all budgets to see how unique these success features are to lower budget movies. It would also be interesting to expand the definition of success to viewer and critic ratings, such as IMDB or Rotten Tomatoes, to see how viewers define success.
Code and presentation
My scraping scripts and an iPython notebook with my analysis is available on my GitHub repo. My findings presentation can be viewed here.
Questions or comments? Feel free to shoot me an email at lam.diana.hc@gmail.com!