diana lam
MTALead - Modeling Pedestrian Patterns During the L Train Shutdown
Hi friends! It’s been a while. I’ve spent the last two years working on a range of fascinating behavioral modeling and natural language processing projects at Capital One. While I’ll never tire of working with the wealth of customer and transactions data we have, the urbanist in me has been wanting to get involved again in the civic tech world. What better way than to participate in a NYC OpenData hackathon?
Last month I participated in the NYC Open Data L Train Innovation Challenge, which asked its participants to come up with data-centric solutions to address various social, environmental, and economic issues related to the implending L Train shutdown.
Context
The L train is one of New York City’s subway lines that connects Brooklyn to Manhattan. Roughly 400,000 people ride the L train each day, with about 225,000 of them riding between Brooklyn and Manhattan.
Similar to the city’s other Brooklyn-Manhattan connecting lines, the L train tunnel suffered significant damage during Super Storm Sandy in 2013. However, unlike other lines such as the R and 4/5, which converge with other lines before crossing into Manhattan, the L is relatively isolated in Brooklyn. This has made the prospect of repairs difficult without a full shutdown.
While the MTA has made some adhoc repairs to postpone closing of the tunnel, full repairs will require an 18 month complete shutdown of the route between Bedford Avenue (the last stop in Brooklyn) and 8th Avenue (the last stop in Manhattan).
The L line is one of the city’s most overcrowded Subway lines that’s also prone to frequent delays (track fires, signal problems, broken trains). As someone who lives on this line and commutes during rush hour, I face some delay at least once a week.
This line desperately needs an upgrade, but those who live on it are also extremely dependent on it, which has caused a bit of a panic about the impending shutdown. It’s on everyone’s mind.
The challenge
There were a selection of questions posed by the organizers, ranging from social (how can new commuting routines increase social capital?), environmental (how can we encourage more environmentally friendly travel options, such as biking?), and economic.
I chose to work on this problem:
How can we accurately model current pedestrian flows and volumes? How can we predict the impact of the shutdown on these flows?
I’ve worked with NYC’s open data before and been frustrated by the lack of detail in its seemingly giant datasets. Without good data, there can be no science or machine learning, so this problem spoke to me.
We worked closely with Seth Hostetter, the Director of Safety Analytics and Mapping at the Department of Transportation to better understand the current data-gathering process and opportunity areas. It’s hard to believe, but right now the City’s pedestrian-tabulation system consists of sending people out to stand on 100 street corners with clickers for 12 hours twice a year. Opportunity to make this process easier, more comprehensive, and representative? Yes!
I teamed up with a few other folks who felt the same way, creating an interdisiciplinary team of designers, engineers, and data scientists.
Process
We do a lot of design-thinking workshops at Capital One, complete with post-its, sharpies, and lots of rearranging and theme-generation. Surprisingly (or not), I found us naturally falling into this pattern during our brainstorming session, and led the group through the process to better structure our ideas.
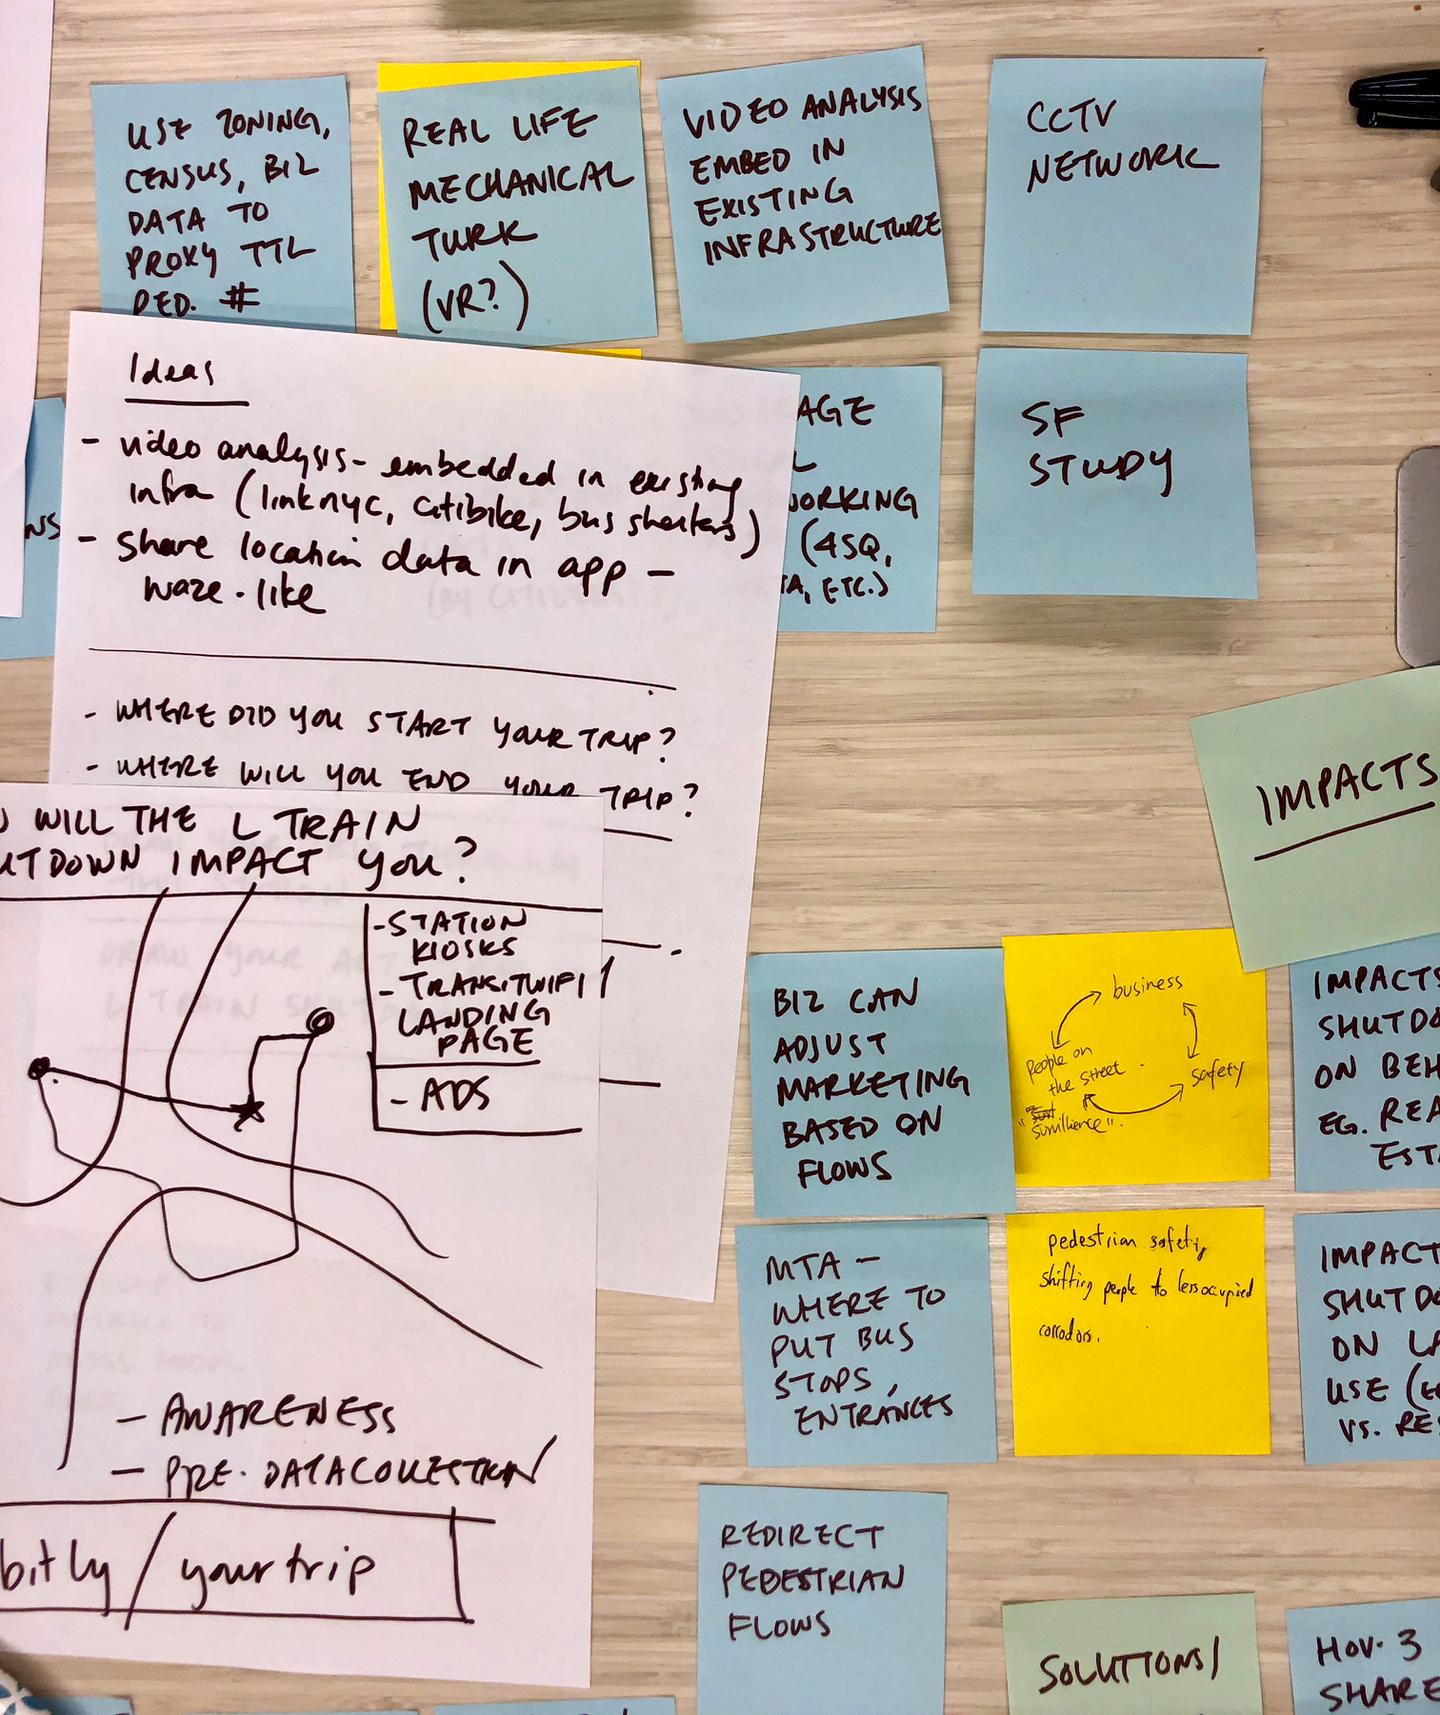
We had some fun ones, including a gaming app that would incentivize people to do adhoc pedestrian counts, but ultimately settled on something slightly more realistic.
MTALead: Real-time pedestrian flows for all
Knowing that the shutdown poses a problem for both the MTA/DoT, riders, and neighborhood residents/business owners, we had three main goals we wanted to accomplish:
- Increase awareness prior to the shutdown and help commuters plan alternate routes.
- Collect accurate, representative data on pedestrian flows in an efficient manner to help the MTA/DoT plan for the shutdown.
- Generate real-time pedestrian flows during the shutdown to help impacted business owners.
Our proposal consisted of three components:
1. Pre-shutdown: Collect data on current and planned movement patterns
We wanted to gather information on current patterns and how these would change based on the shutdown. This would be the driver for future data collection and modeling. A secondary focus was to leverage existing infrastructure instead of installing costly new fixtures or sending out human bodies.
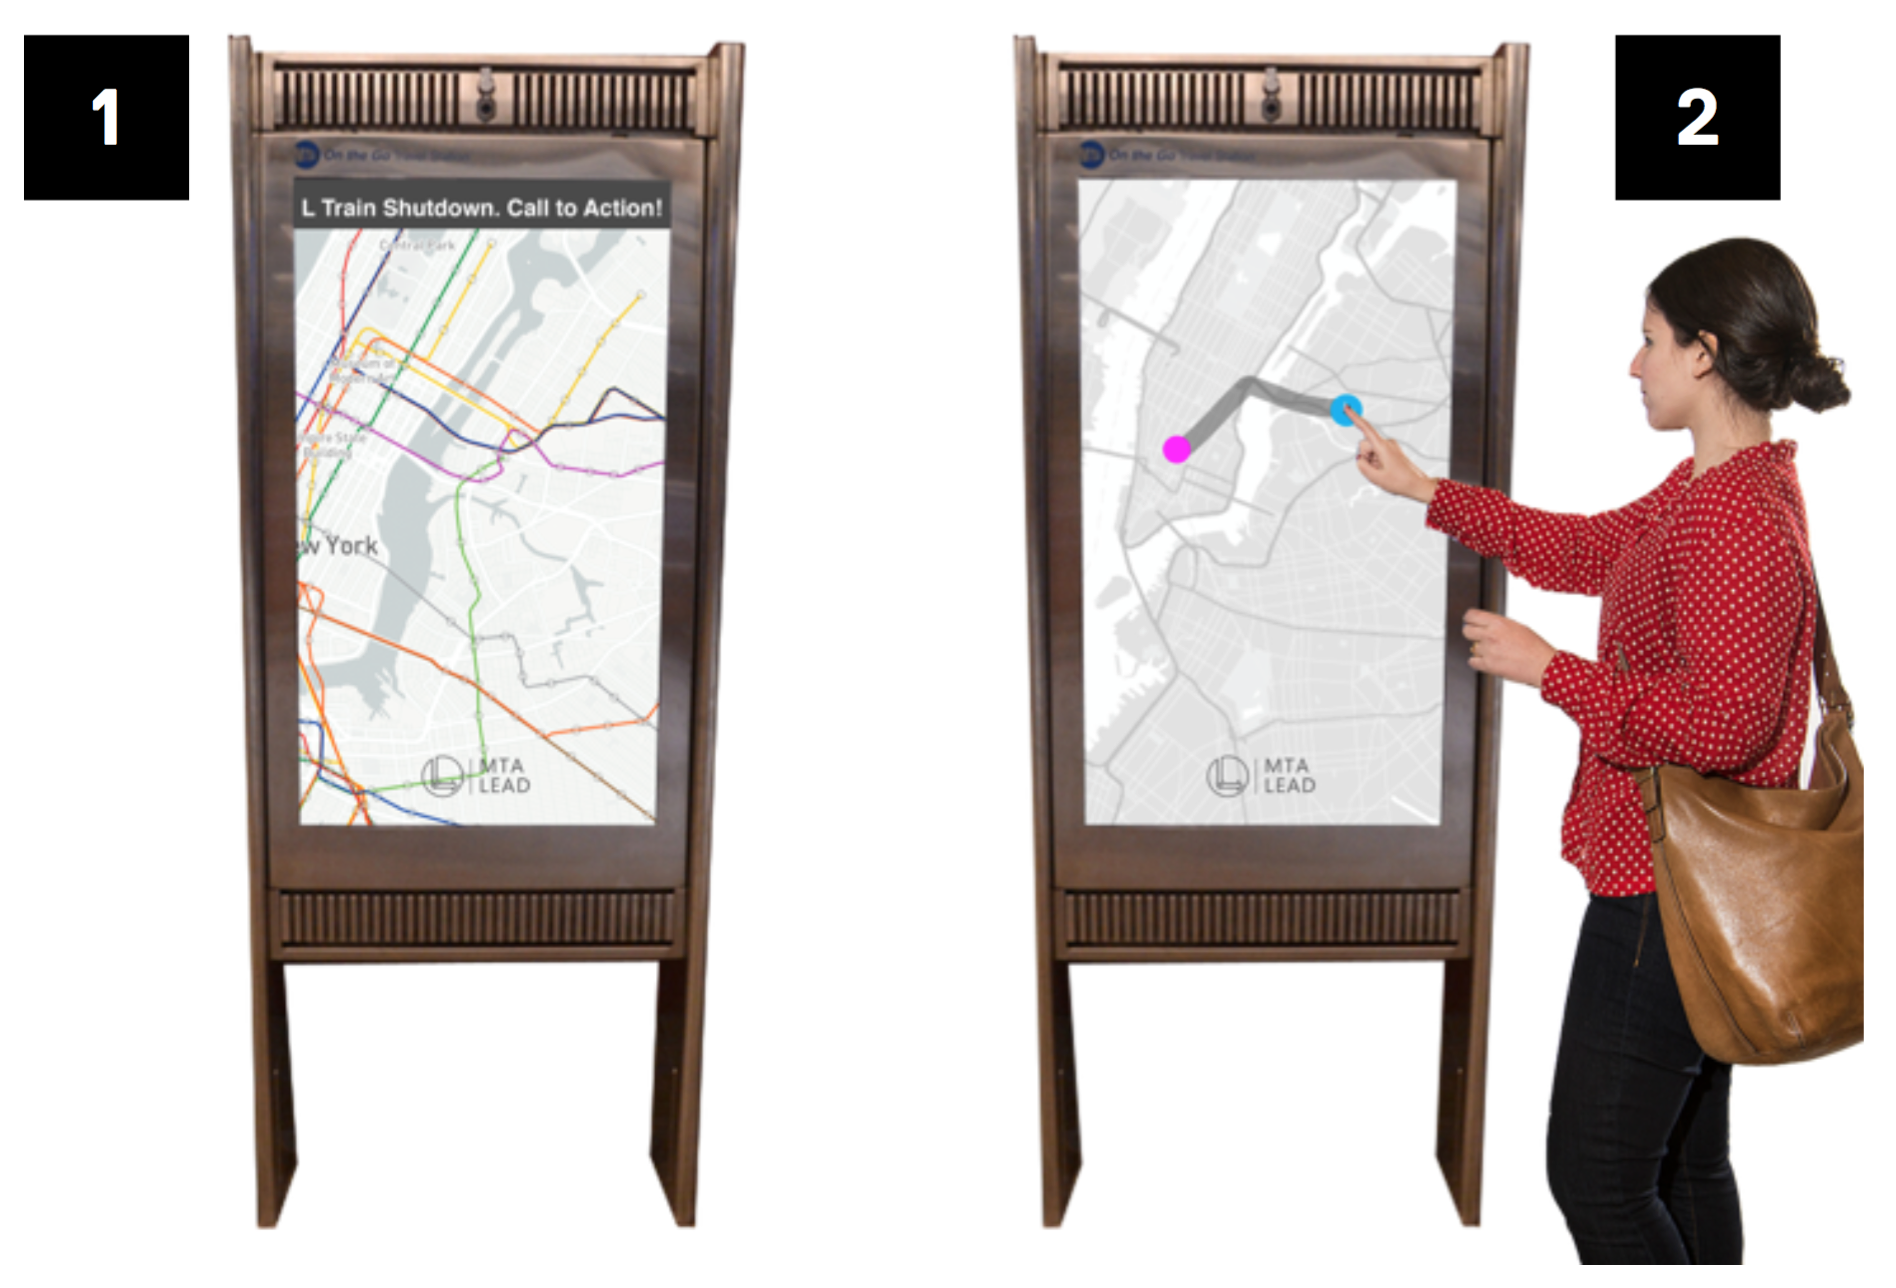
Prior to the shutdown, we’ll create a new interactive map survey, which will ask L train riders to map their current route and future route. These surveys will run on the MTA’s existing interactive station kiosks as well as on the transit wi-fi’s landing page within stations impacted by the shutdown. The survey will also offer riders guidance on the optimal route to take during the shutdown.
This will be a quick, seamless way to gather information, while raising awareness and providing solutions for riders.
2. During shutdown: Validate planned movement patterns
Based on the data collected during the previous step, we’ll identify representative locations and times to send people-counters to validate the expected pedestrian counts and flows.
The goal of this step is to gather real movement data that represents the range of conditions that could be present (e.g. a residential area during a sunny weekend morning vs. a commercial area during a rainy weekday night). We’ll consider factors such as weather, time of day, day of week, demographics, transit access, population density, and land use, among others.
It would be great if we could find a way to automate counting, since having people count pedestrians isn’t optimal. We toyed around with the idea of employing computer vision software to detect and tabulate pedestrians, but installation would be costly and Seth was concerned there may be a privacy issue.
We wanted a solution with a low barrier of entry for the MTA/DoT; in the end, we decided to continue using people-counters since it’s a system they’re already familiar with. The innovation in this step will be to optimize where and when to send people-counters so that we use their time maximally.
3. Generate real-time flow predictions
We’ll use the validation data from the representative areas to build a model to generate real-time flow predictions for use during the L train shutdown. The model will use the same characteristics mentioned in the previous step as inputs and generate predictions based on the location and real-time condition.
Note that a few cities, including San Francisco, have designed pedestrian flow mdoels based on observed counts at selected locations. While these locations are intended to be representative, they are based on physical characteristics, such as speed limits and road grades. Selecting locations based on these conditions may not be representative of actual pedestrian behavior, especially when you factor in conditions such as weather and time of day. We believe that focusing on a smaller area and choosing our count locations based on real pedestrian data will result in a much more accurate model.
4. Enable data consumption for impacted parties
What is data without an easy way to consume it? Once we’ve generated our real-time predictions, we want to empower impacted parties to use this data to better adapt to the shutdown.
For example, a restaurant owner along the L line who is worried about a decline in the number of customers could use the real-time flows to target his marketing efforts. The MTA could use the flows to understand the optimal bus locations and routing.
Even better, these real-time pedestrian flows can be a new form of Open Data for the City and citizens interested in mobility data.
We won!
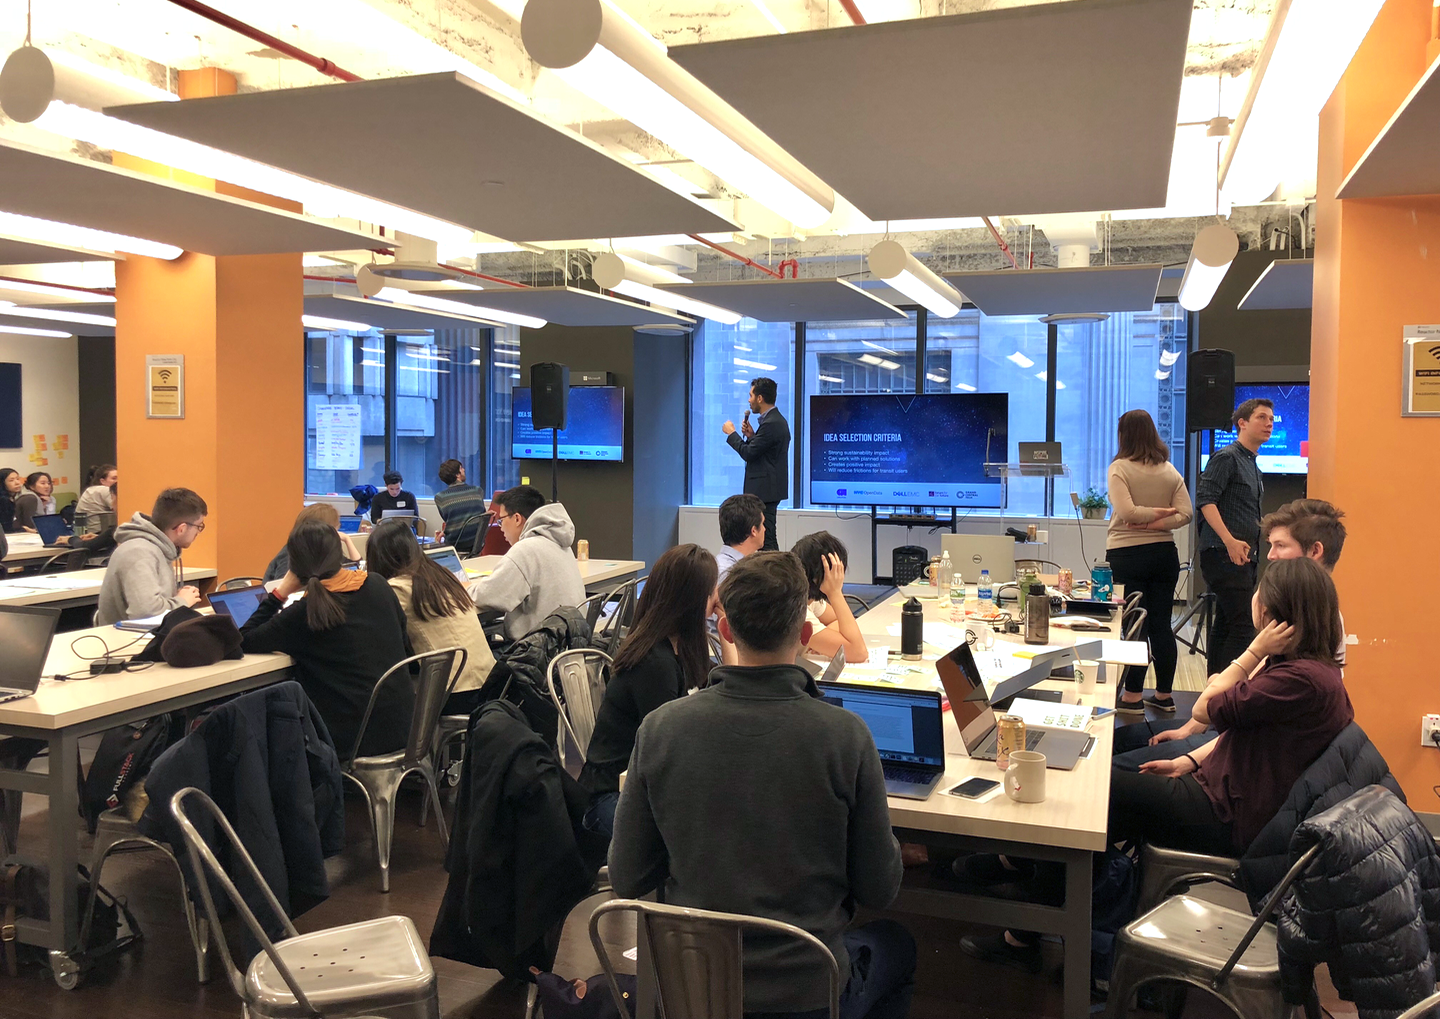
After six hours of ideation and planning, we presented our idea to the judging panel.
We won second place! Here’s us with our paper money winnings.

Typically, I shy away from hackathons because I’m not a huge fan of the feverish environment. A few hours is never enough time to build out a great solution, particularly when the problem statement is massive. However, I thoroughly enjoyed this experience. We had a diverse team with a multitude of fresh perspectives, a focused problem, and a knowledgable subject-matter expert who provided feedback on feasibility. For my inaugural foray back into civic tech, this was a fantastic experience. I’m looking forward to staying involved in the community
Know of civic tech opportunities or interested in chatting more about MTALead? I’d love to hear from you! You can reach me at lam.diana.hc@gmail.com.